1.1 About Computer Graphics
The
term computer graphics has been used in a broad sense to describe "almost
everything on computers that is not text or sound". Typically, the term computer
graphics refers to several different things:
- the
representation and manipulation of image data by a computer
- the
various technologies used to create and manipulate images
- the
sub-field of computer science which studies methods for digitally
synthesizing and manipulating visual content, see study of computer
graphics
Computer graphics are graphics created using computers
and, more generally, the representation and manipulation of image developments in computer graphics have had a profound
impact on many types of media and have revolutionized animation, movies and the video game industry.
1.2 IMAGE TYPES
2D computer graphics are the computer-based generation of digital images—mostly from two-dimensional
models, such as 2D geometric models, text, and digital images, and by techniques
specific to them Pixel art
Pixel
art is a form of digital art,
created through the use of raster graphics
software, where images are
edited on the pixel level.
Graphics in most old (or relatively limited) computer and video games, graphing
calculator games, and many mobile
phone games are mostly pixel art.
Vector graphics formats are complementary to raster
graphics. Raster graphics is the representation of images as an array of pixels
and is typically used for the representation of photographic images. Vector graphics consists in encoding
information about shapes and colors that comprise the image, which can allow
for 3D computer graphics in contrast to 2D computer graphics are graphics that
use a three-dimensional representation of geometric data that is stored in the computer
for the purposes of performing calculations and rendering 2D images. Such
images may be for later display or for real-time viewing’s more flexibility in
rendering.
1.3 Open GL
OpenGL is the premier
environment for developing portable, interactive 2D and 3D graphics
applications. Since its introduction in 1992, OpenGL has become the industry's
most widely used and supported 2D and 3D graphics application programming
interface (API), bringing thousands of applications to a wide variety of
computer platforms. OpenGL fosters innovation and speeds application
development by incorporating a broad set of rendering, texture mapping, special
effects, and other powerful visualization functions. Developers can leverage
the power of OpenGL across all popular desktop and workstation platforms,
ensuring wide application deployment.
OpenGl runs on every
major operating system including Mac OS, OS/2, UNIX, Win32/64, Linux, OPEN Step
and BeOS as well as embedded real time Oss and game consoles. It is callable
from Ada, C, C++, FORTRAN, and java and offers complete independence from
network protocols and topologies.
1.4 About Project
This
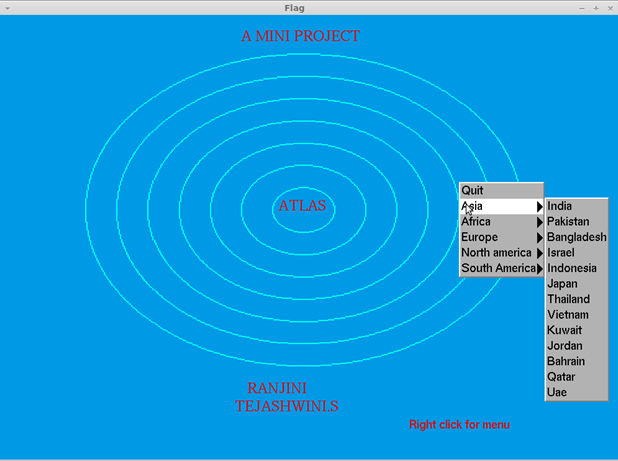
mini project “ATLAS” provides us
with the information about countries,
their capitals and flags. It can be considered
a subset of a real life atlas. It is an
interactive project, since it allows the user to pick the country of his/her
choice and know all about it. The user
first of all arrives at a main screen after which he can select a continent of
his/her choice. Further he will be led to a set of countries which are present
in the selected continent. Amongst the set provided the user can select a
country. The name, capital and flag of the country will be displayed on
screen.. He/she can traverse through the countries and their flags with help of
suitable menus provided.
Design
The complete overview of the project is shown in the
block diagram; it shows how it will perform actions through out its execution.
The design depicted in the figure 3.1 specifies that
initially the user is provided with a menu of continents. Amongst these the
user selects one using the mouse interface. Further the Sub-menu of countries
within the selected continent is displayed.
Amongst these the user again selects one country using the mouse. Finally the flag of the
county is displayed along with the county’s name and its capital.
3.2
Algorithm
Step 1: Start
Step 2:
Initialize and specify the size, position and creates the output window.
Step 3:Specify the view volume
Step 4: Create a menu for users
Step 5:Create
an interaction for the user to select from the menu
Step 6:Create
the respective flags.
Step
7: Stop


No comments:
Post a Comment